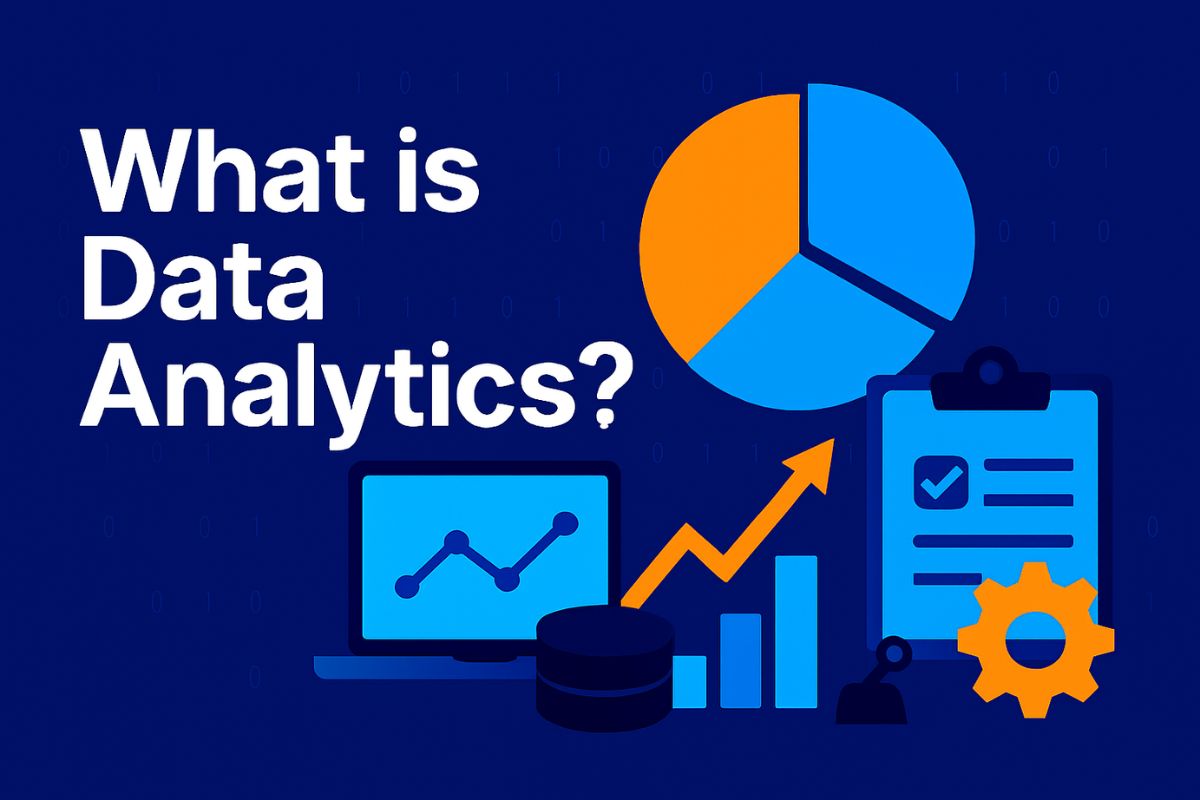
Data analytics is the science of analyzing raw data to uncover trends, patterns, and insights that support decision-making. In this blog, learn what data analytics is, its types, tools, real-world use cases, skills needed, and how you can start a career in this booming field globally.
In today’s data-driven world, businesses, governments, and individuals rely heavily on data to make smart decisions. But how does raw data become meaningful insights? That’s where data analytics comes in. From personalized ads to predictive health care, data analytics is shaping our world.
In this comprehensive 2025 guide, you’ll learn what data analytics is, how it works, its various types, top tools, real-life applications, career prospects, and how to start your journey as a data analyst—no matter your background.
What is Data Analytics?
Data analytics is the process of collecting, cleaning, transforming, and analyzing data to discover useful information, draw conclusions, and support decision-making.
In simpler terms: it’s about turning numbers and information into meaningful stories.
Difference Between Data Analytics and Data Analysis
- Data Analysis is the act of examining data.
- Data Analytics is a broader field that includes the infrastructure, tools, and methodologies for performing data analysis at scale.
Why Data Analytics Matters Today
- Businesses make faster, more accurate decisions
- Enhances customer experience and personalization
- Detects fraud and operational inefficiencies
- Powers innovation through predictive insights
Types of Data Analytics
Descriptive Analytics
Summarizes past data to understand what happened. Example: monthly sales reports.
Diagnostic Analytics
Answers “why did it happen?” Uses tools like root cause analysis.
Predictive Analytics
Uses data, algorithms, and ML models to forecast future outcomes.
Prescriptive Analytics
Recommends actions. Combines predictive models with rules and simulations to advise decision-makers.
Cognitive/Real-Time Analytics
Advanced systems that adapt in real time using AI and automation.
How Data Analytics Works – The Process
Step 1 – Data Collection
Data is gathered from various sources: surveys, IoT devices, CRMs, databases, etc.
Step 2 – Data Cleaning
Remove duplicates, errors, and irrelevant information.
Step 3 – Data Analysis
Apply statistical models, queries, or ML techniques to analyze the cleaned data.
Step 4 – Data Visualization and Reporting
Use tools like Tableau, Power BI, and Excel to visualize trends.
Step 5 – Data Interpretation and Action
Insights are turned into business strategies or solutions.
Data Analytics vs Data Science vs Business Intelligence
| Feature | Data Analytics | Data Science | Business Intelligence |
|---|---|---|---|
| Focus | Insight from existing data | Predictive modeling & ML | Reporting & dashboards |
| Tools | Excel, SQL, Power BI | Python, R, Jupyter, TensorFlow | Tableau, QlikView |
| Skills Needed | Stats, Excel, Visualization | Programming, ML, Deep Learning | SQL, KPIs, Dashboards |
| Time Frame | Past & Present | Future-oriented | Mostly past |
Real-World Applications of Data Analytics
Healthcare
- Predict disease outbreaks
- Improve diagnostics with patient data
E-commerce & Retail
- Personalized product recommendations
- Inventory and supply chain optimization
Finance & Banking
- Fraud detection
- Credit scoring and risk management
Marketing & Advertising
- Customer segmentation
- Campaign performance analysis
Sports & Entertainment
- Player performance tracking
- Audience preference analytics
Most Popular Data Analytics Tools (2025)
| Tool | Type | Best For | Pricing | Learning Curve |
| Excel | Spreadsheet | Beginners, Reports | Free/Paid | Easy |
| Power BI | BI Tool | Dashboards | Paid | Medium |
| Tableau | BI Tool | Visualization | Paid | Medium |
| Python | Programming | Advanced Analytics | Free | Medium/Hard |
| R | Programming | Statistical Work | Free | Hard |
| SQL | Language | Data Querying | Free | Easy/Medium |
Skills Required to Become a Data Analyst
- Technical Skills: Excel, SQL, Power BI, Python, Tableau
- Analytical Thinking: Ability to break down problems and interpret trends
- Communication: Presenting findings in a clear, visual way
- Optional Add-ons: APIs, statistics, machine learning basics, data ethics
Career Scope & Salary Trends in Data Analytics (Global 2025)
| Country | Entry-Level Avg Salary | Experienced Avg Salary |
| USA | $60,000/year | $100,000+/year |
| India | ₹5–10 LPA | ₹15–25 LPA |
| UK | £30,000/year | £60,000+/year |
| Canada | CAD 55,000+/year | CAD 90,000+/year |
| Remote Roles | Varies | $70k–120k |
Expert Tips & Common Mistakes in Data Analytics
Tips:
- Always clean your data first
- Keep your business goals in focus
- Learn one tool deeply before jumping to many
- Stay updated with industry trends
Mistakes:
- Relying too much on tools, not enough on interpretation
- Ignoring data visualization
- Misunderstanding correlation vs causation
Free Resources and Learning Path to Get Started
- Free Courses:
- Google Data Analytics on Coursera
- Microsoft Learn (Power BI & Excel)
- Books:
- “Storytelling with Data” by Cole Knaflic
- “Data Science for Business” by Provost & Fawcett
- Platforms:
- Kaggle (Projects + Competitions)
- GitHub (Sample projects)
- YouTube (free tutorials on Python, SQL, Tableau)
Conclusion
Data analytics is no longer a luxury—it’s a necessity across industries. Whether you’re a student, job seeker, or professional, learning data analytics can open global opportunities in 2025 and beyond. Start small, pick one tool, and build your skillset one project at a time.
Let us know what you want to explore next — and don’t forget to share this guide with others!
FAQs
1. What is data analytics in simple terms? It’s the process of studying raw data to find patterns, trends, and insights for decision-making.
2. Is data analytics a good career in 2025? Yes. With the rise of digital transformation, data analytics is one of the top in-demand skills globally.
3. What tools should I learn for data analytics? Start with Excel and SQL, then move to Power BI, Tableau, or Python.
4. Do I need to learn coding for data analytics? Not always. Many tools are low-code or no-code, but Python or R can help with advanced tasks.
5. How is data analytics used in real life? It’s used in healthcare, banking, marketing, retail, and even sports to optimize operations and predict outcomes.
6. What is the difference between data analytics and data science? Analytics focuses on interpreting data, while data science involves building models, algorithms, and machine learning.
7. Is data analytics hard to learn? It’s beginner-friendly, especially with tools like Excel and Power BI. You can scale up gradually.


